Speer: Permabears Keep Calling Bad Plays
Permabears and Doomsters: The beef industry’s permabears and doomsters harbor a laundry list of complaints about the business: packers, Checkoff, NCBA, price discovery, imports, futures markets, etc…. And they often like to tell us about how the industry is corrupt and/or broken. They want us to believe it’s all in crisis, and the deck is stacked against producers – all the while NCBA and the packers are padding their pockets. But is any of that accurate?
Fed Market: When it comes to producers, the litmus test is the fed market. It represents the end of the line in terms of available dollars for the production sector. And if it gets squeezed, the pool of money available for backgrounders, stockers and cow/calf producers becomes limited. IF things are as the permabears contend, then we should be able to easily witness the market’s demise over time.
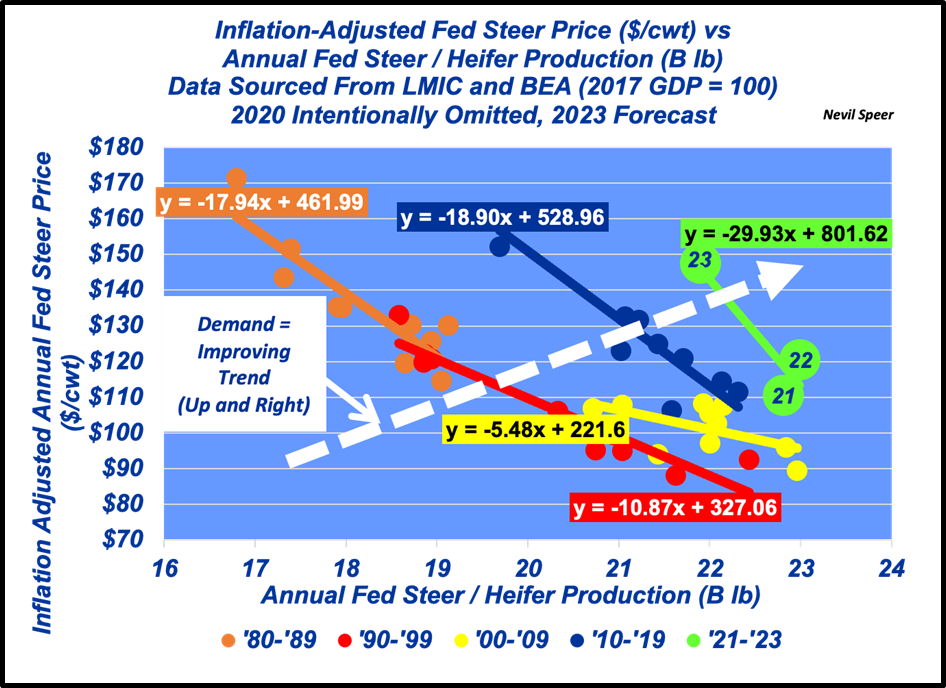
Apples To Apples: With that in mind, let’s jump into the pragmatic evidence of how the business – i.e. the fed market - has fared over the past four decades. The first graph below represents inflation-adjusted fed cattle prices plotted against annual fed steer / heifer production
(apples-to-apples comparison). The data is represented by decade for comparative purposes. (For reference, the data is detailed at the end of the column.)
Several items immediately jump out:
- The trend over time is clear – up-and-to-the-right.
- Correlation.
- Note the tight groupings in each decade around the line-of-best fit (effectively representing demand curves for fed cattle). Except for ’00-’09 (largely due to the effects of BSE and the Financial Crisis), the correlation between production and price is .90-or-better in each decade.
- The relationship is especially important with respect to the previous decade. Most notably, the supply/price relationship for ’16-thru-’19 (no COOL) didn’t deviate from the pattern established the previous six years (’10-thru-’15 COOL). In other words, neither COOL, nor repeal, had any impact on fed cattle prices.
But What About….?: I can hear the murmuring…
- The highest fed cattle price ($171 inflation-adjusted) occurred in 1980; “See there – it’s been a steady decline ever since.” But note production was only 16.8 B lb.
- The second-highest inflation-adjusted price recorded in the series occurred in 2014. “We’ve never gotten back to that level.” But again, that was on fed cattle production of only 20.1B lb.
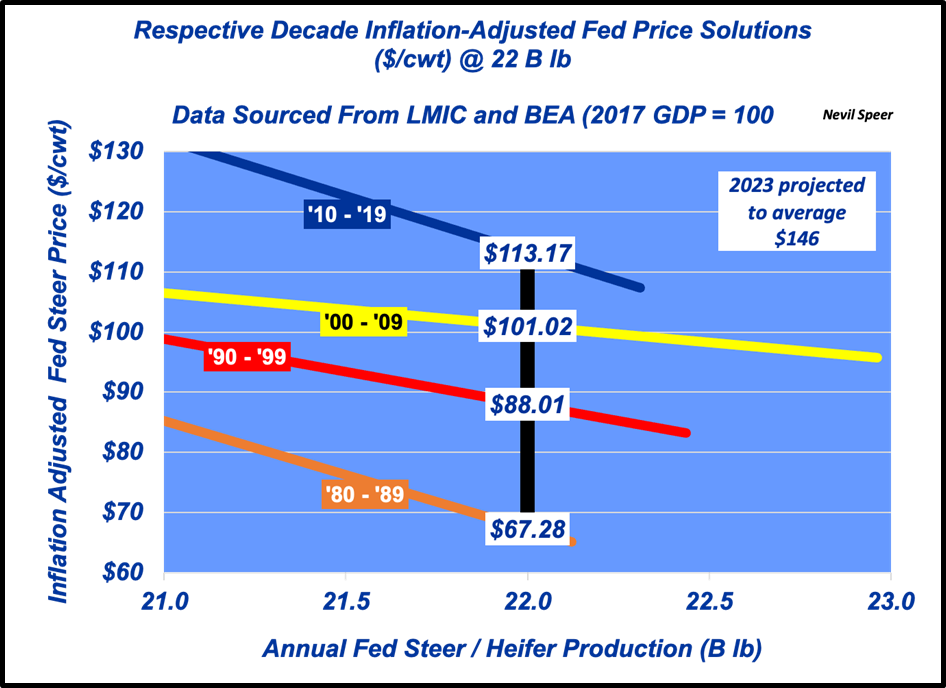
Current Decade: Fast forward to ’21-’23 (2020 is intentionally omitted in the analysis due to statistical noise caused by Covid’s market anomalies). Let’s zero in on 2023; this year’s annual fed cattle market will average ~$177/cwt (nominal price) - equivalent to an inflation-adjusted value of ~$146/cwt, with production encroaching 22 B lb (based on data through September and in-line with WASDE detail). We can nitpick on the 2023 predictions, but what really matters is the broader beat detailed below.
Let’s compare that throughput against previous decades. Inflation-adjusted solutions for each decade at 22B lb of throughput are provided below (based on the derived linear solutions and detailed in the second graph). The difference is huge!
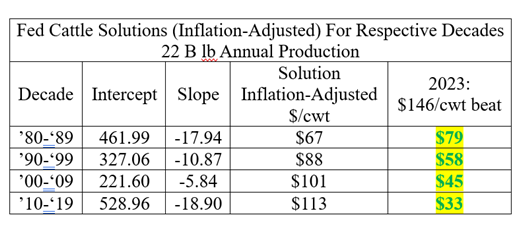
Bad Coaching: Beef IS winning in the marketplace – it’s not even close. Consumers are voting in favor of beef (Up And To The Right). The result being the fed market is stronger than ever: Better Business Means Better Markets. (That reality is also reinforced at the opposite end of the spectrum; cattle prices bottomed in 1998 – coinciding the low-water mark for beef demand.)
The permabears don’t want to hear any of that. So, instead of studying film, their strategy for winning is just to gripe and yell from the sidelines – there is no real gameplan. And as a result, they just keep calling bad plays.
Nevil Speer is an independent consultant based in Bowling Green, KY. The views and opinions expressed herein do not reflect, nor are associated with in any manner, any client or business relationship. He can be reached at nevil.speer@turkeytrack.biz.