Speer: Yardstick of Quality

Quality Grade: As discussed in the previous column, the improvement in the quality grade mix over time has proven transformative for the beef industry: “Prime and Branded sales account for 60% of the new dollars coming into the business since 2005…the categories own annual [sales] growth rates exceeding 14% and 10%, respectively, during that time.” Marbling is the difference maker when it comes to consumer satisfaction and subsequent revenue growth for the industry.
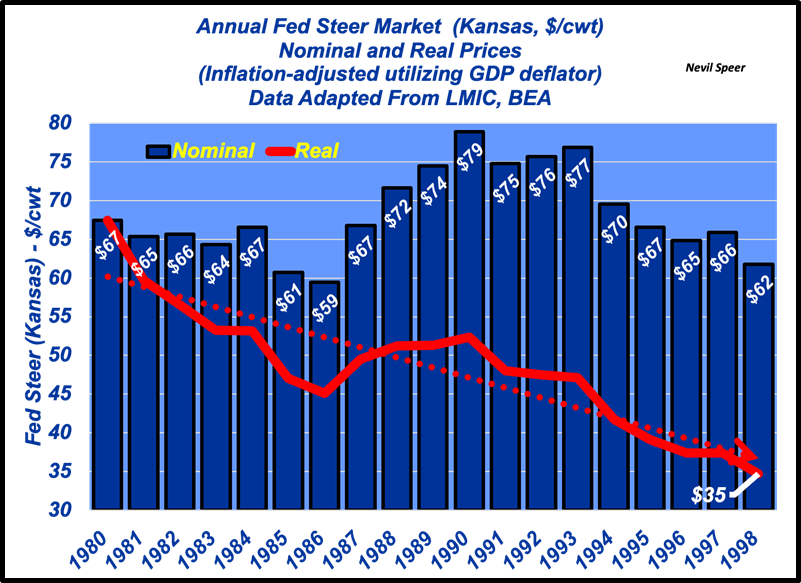
Consumer Spending: At the very core, the beef industry IS a consumer business – or alternatively, consumers ARE the business. And while some might dispute that thinking, they forget (or never learned) the lessons of overlooking product quality during the ‘80s and ‘90s. Beef spending grew only $6/person between 1980 and 1998 (meanwhile, inflation was running at ~4%). The industry was flailing; beef was fat, tough and wonky. And the fed market reflected that reality. (see first graph)
That’s since turned around. Since 2000, per capita domestic spending has grown ~$11 annually – representing an annual growth rate of ~3.7% (beating inflation by better than 1%). That means more dollars coming into the business - and as referenced above – the overwhelming majority resulting from sales at the top end of the quality grade mix.
Fed Market: Those dollars make all the difference. The second graph details the relationship between annual spending and fed price since 1990 – the correlation is .86. (In this instance, correlation does reflect causation).
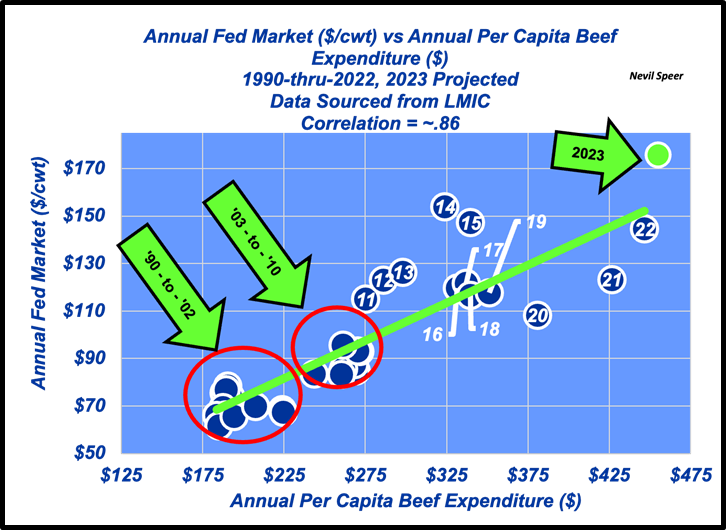
A couple of items of interest. First, ’14 and ’15 exceeded the historical pattern – the positive deviation driven by especially sharp declines in supply. Meanwhile, ’20 and ’21 under-performed the trendline due to covid (and burdensome supplies). Most important, 2023 established an especially sharp positive deviation – even in the midst of inflation, consumers continued their willingness to trade up for their protein purchases (see Beef Charging Ahead) lending support to all-highs in the fed market.
As a side note, you can view an alternative comparison of the favorable shift in fed prices over time here: Permabears Keep Calling Bad Plays.
Consumption: Meanwhile, the Checkoff critics, as explained here, try to leverage a meaningless (and misleading) talking point. That is, waning domestic beef consumption somehow indicates weakening consumer preference. The critics then extrapolate that talking point to have us believe the program isn’t benefitting producers.
What’s the data say about the claim? If it’s true, it’s also means declining beef consumption lends itself to higher fed prices. (see third graph)
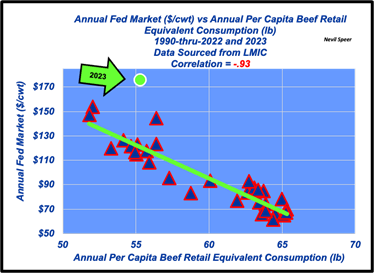
Of course, in this instance correlation does NOT imply causation – the consumption measure alone indicates nothing about demand or spending (the metric that really matters). (For more on the consumption topic, see OFF Boondoggle)
Yardstick Of Quality: What’s the net-net to all this discussion? Steve Jobs summarizes it best: “Be a yardstick of quality. Some people aren’t used to an environment where excellence is expected.”
So, net-net: quality always pays dividends when it comes to consumers – it drives satisfaction – and in turn strengthens demand. All that in aggregate equates to more spending and better prices.
Nevil Speer is an independent consultant based in Bowling Green, KY. The views and opinions expressed herein do not reflect, nor are associated with in any manner, any client or business relationship. He can be reached at nevil.speer@turkeytrack.biz.