Speer: Build It And They WILL Come

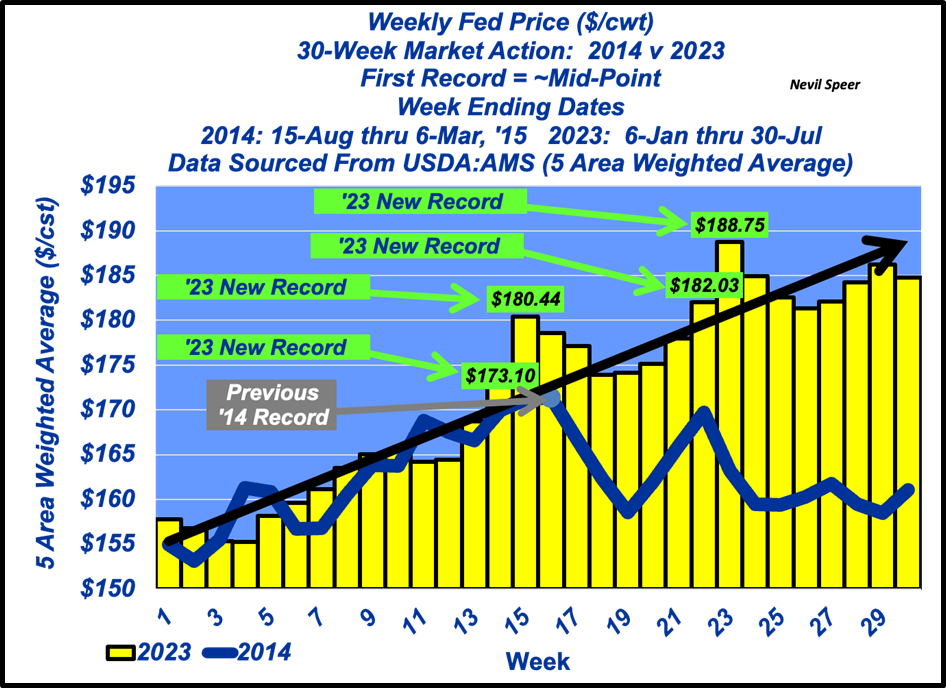
30 Weeks: As the fall run approaches, some context on this year’s market thus far seems warranted. Given 2023’s new records, perhaps the best approach is to provide a side-by-side comparison versus 2014. Through July, we’re thirty weeks into the year. So, let’s evaluate 2014 and 2023 with roughly 15 weeks on each side of their respective records.
2014: The previous 5 Area Weighted Average record was established in mid-November at $171.38. The record represented a surge of ~$16 versus the starting point fifteen weeks earlier. However, the market faded from there and ultimately chopped around $160 into early-March, 2015 – the final six weeks of the overview.
As a side note, fed trade made one final stab at ~$168 in early-April but just two weeks later settled back into the established trading range. All that to say, following the record, fed trade had a long sideways tail with action at mostly $160-161 through May.
2023: This year’s fed trade began just a few dollars ahead of the August, 2014 starting point. Cash prices then drifted lower into mid-January. However, from there sellers caught some traction; the new record was established in early-April at $173.10. It didn’t end there; new records were established again ($180.44) and again ($182.03) and again ($188.75). And fed prices have traded near the top of the range ever since.
Thus far in 2023, the market owns a very different pattern versus the 2014 market top. Point-to-point (across 30 weeks), the 2023 market is up $27 – that beats 2014 by $20. And the ending four-week average in 2023 is just $4 off the record – versus 2014 when it was $11 softer compared to the previous record. (see graph below)
Volume: The 2014 vs 2023 contrast is even more significant when considering volume. Weekly fed steer and heifer slaughter during 2014’s record-setting run averaged 437,285 head. Thus far in 2023 the average is ~486,500 head. In other words, the 2023 market has absorbed an additional 50,000 head of fed steer / heifer harvest per week versus 2014.
Let’s then turn to the difference in weekly beef production: 2014 averaged ~451 M lb; 2023’s average through July stands at ~512 M lb (+13.5%). In other words, 2023’s record setting fed market has not only blown past 2014 in terms of price – but has done so against significantly bigger volume!
The Difference Maker: What’s the difference between 2014 and 2023? That is, to what should we attribute this year’s stellar market performance?
Before we get to that, let’s first cross off the list of things that have NOT made a difference:
- More cash trade: the level of cash trade has remained unchanged in 2023 (~19%) – roughly in line with the 30-week overlay in 2014.
- Less packer concentration: that, too, hasn’t been altered (the new start-up plants aren’t yet operational).
Meanwhile, this discussion wouldn’t be complete without some mention of COOL. Supporters have long contended market momentum between 2009 and 2014 was attributable to COOL. And then point to softer prices beginning in 2015 when the law was repealed. This year’s market action clearly confounds that logic.
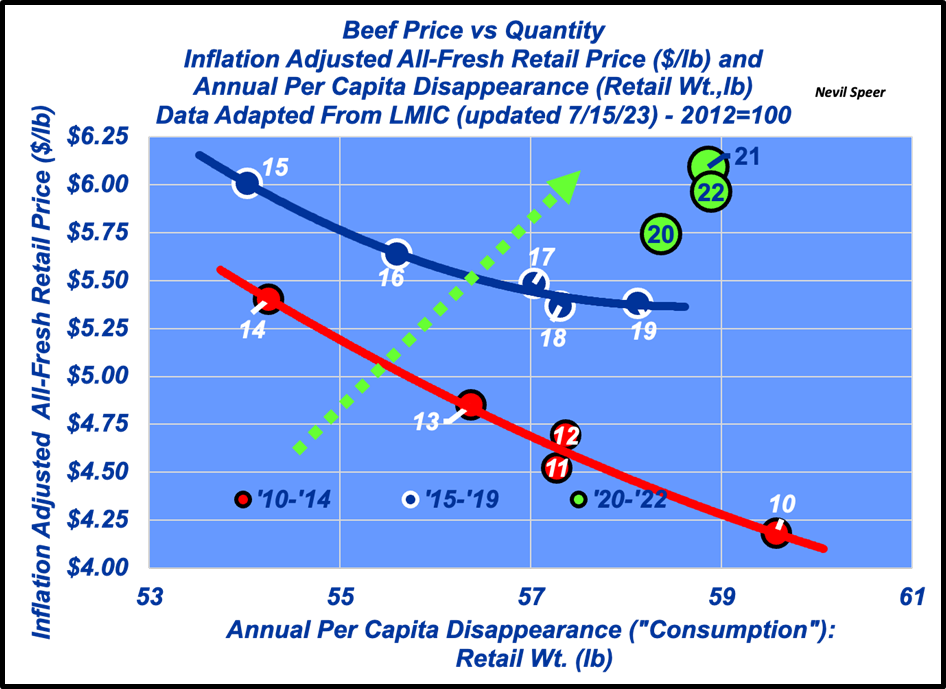
They WILL Come: The 2023 market has been nothing short of phenomenal, exceeding even the most bullish forecasts. Bottomline: the difference maker between now (2023) and then (2014) is ongoing consumer focus having resulted in better beef demand. (see graph below)
The cornerstone of that success is built on:
- producing a better product,
- delivering it consistently, and
- promoting it effectively.
As evidenced by 2023, those efforts pay dividends. Build it and they WILL come!
Nevil Speer is an independent consultant based in Bowling Green, KY. The views and opinions expressed herein do not reflect, nor are associated with in any manner, any client or business relationship. He can be reached at nevil.speer@turkeytrack.biz.